Y Combinator is not the whole startup market, but it is arguably its most legible leading indicator. The accelerator funds hundreds of companies a year, publishes a structured directory of every one of them, and has done so consistently for two decades. When YC's batch composition shifts, it usually reflects (and sometimes anticipates) where early-stage capital and founder ambition are heading.
TL;DR. Across 6,059 YC companies and 50 batches (2005–2026): AI grew from ~20% of each batch in 2021 to over 60% by 2024. It is now the default, not a category. Consumer startups (B2C) collapsed from a third of YC to under 6%, while B2B broke a decade of stability to reach two thirds of every batch. Fintech and crypto already traced full hype cycles, and hard tech is quietly tripling. Every chart is reproducible from the open dataset.
I pulled the full public directory: 6,059 companies across 50 batches, from Summer 2005 through the batches currently underway in 2026. Every chart below is reproducible: the dataset, the collection scripts, and the analysis code are on GitHub. Methodology and caveats are at the end, because a few of them genuinely matter for interpretation.
Three shifts stand out. One is loud, one is quiet, and one is a cautionary tale.
It would be easy to stop at description: this went up, this went down. What matters more is the mechanism behind each shift, because that's what tells you whether it's still worth following or already fading by the time you'd act on it. That's the lens for what follows.
The loud one: AI went from theme to default
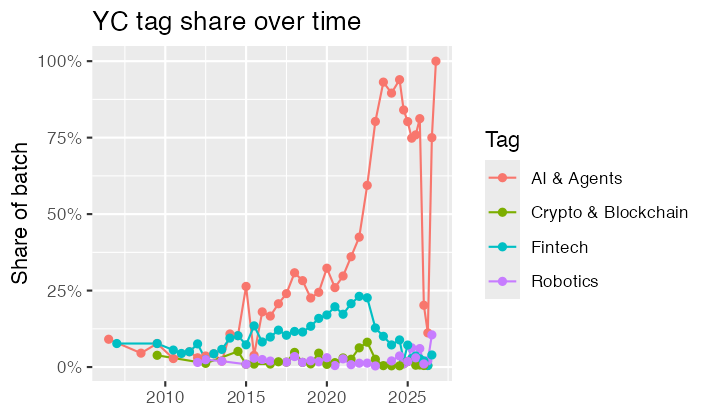
In Winter 2021, roughly one in five YC companies carried an AI-related tag. By Winter 2023, the first full batch selected after ChatGPT's release, it was half. By Winter 2024, over 60%, and the recent batches for which tagging is complete hover in the same territory.
The more interesting shift is what happens to the category once the label is universal. At a fifth of companies, "AI" describes a sector. At two thirds, it stops differentiating and becomes infrastructure. The same thing happened to "mobile" and "cloud" around 2015, when everyone was mobile and cloud and the words stopped meaning anything. Reading through 2026 batch descriptions, "AI startup" already reads as filler; the AI is assumed, and what actually differentiates a company is one level down, usually a dataset a general model can't touch. A platform sitting on a decade of clinical outcomes, or behavioral logs from millions of real interactions, starts from a position no foundation model can replicate by training on public text.
That's also why the fintech and crypto collapse later in this piece isn't a preview of what happens to AI. Fintech is a regulated vertical and crypto is an asset class, both can fall out of favor while capital moves elsewhere, and both did. AI sits underneath every vertical instead of being one, the way mobile and cloud did before it. The label will keep disappearing from pitch decks as it stops being notable; the technology doesn't leave when the buzzword does.
A note on agents, since that is the word of the moment: YC's own taxonomy does not distinguish agentic companies from AI companies broadly. There is no "Agents" tag. The closest label, "AI Assistant," is used sparingly. That alone tells you something: the category boundaries are still blurry enough that even YC has not formalized the distinction. The agent wave is visible in company descriptions, not yet in the metadata.
The quiet one: the consumer startup has nearly disappeared from YC
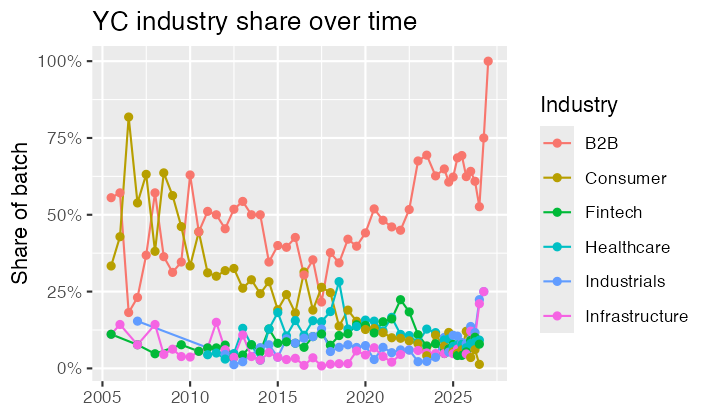
This is the shift I find most under-discussed. In Winter 2012, consumer companies made up around a third of the batch. This was the YC of consumer marketplaces and social apps, the cohort culture that produced Airbnb-style ambitions. That share has declined almost monotonically for a decade.
The mirror image is B2B. For a full decade, roughly 2012 to 2022, B2B held remarkably steady at around 45% of each batch. Then it broke upward: about 63% in Winter 2024. Nearly two thirds of the companies YC funds today sell to other businesses.
The timing of the jump is worth noticing: it coincides exactly with the AI wave. One plausible reading is that the current AI platform shift, unlike the mobile one, is monetizing business workflows first. The obvious early wins: coding tools, support automation, document processing, vertical copilots all have a company as the customer. Consumer AI products exist, but the route from model capability to paying user is shorter and better understood in B2B, and batch composition follows it.
That's the proximate cause. The deeper one predates AI: consumer incumbents (Meta, Amazon, TikTok, Uber, Airbnb) sit on network effects and behavioral data built over a decade, which pushes customer acquisition cost past lifetime value for almost any new entrant. That was already true before 2021. AI added a second effect: it compresses product-market fit into weeks instead of years, and for consumer products that cuts both ways. Chegg lost roughly a billion dollars in market value and 500,000 subscribers within nine months of ChatGPT's release; Stack Overflow's traffic went into freefall once GitHub Copilot started answering the same questions inline. A consumer product with a thin AI layer can now be obsoleted in a single quarter, which is enough to make both founders and accelerators more cautious about the category.
Selling into the enterprise means entering the most crowded field in YC's history. Building for consumers means entering the emptiest one in fifteen years.
None of that means consumer is closed, but the version still getting funded doesn't look like 2012's marketplace-and-social-app playbook. It shares one trait instead: a moat a model can't shortcut, with proprietary usage data, a community that only exists inside the product, or a physical and habitual layer a good interface alone can't replicate. Nextdoor and Strava aren't defensible because the apps were hard to build; they're defensible because the content only exists there. That's a narrower path than the last consumer wave, but it isn't closed. Whether the gap reads as a warning or an opportunity depends on whether you're bringing a defensible data or community position with you.
The cautionary tale: fintech and crypto show what a full cycle looks like
If you want to know what the downslope of a hype cycle looks like in this dataset, it is already there.
Fintech tags climbed steadily through the late 2010s and peaked at over 20% of the batch around Winter 2022, the tail end of the zero-interest-rate era. They have since fallen by more than half. The industry-level data tells the same story: fintech as an industry classification peaked at 22% in Winter 2022 and now sits around 9–10%. Crypto traces a smaller, sharper version of the same arc: a visible bump peaking around 2021–2022, followed by a decline to near zero in the most recent batches.
Part of that steepness is structural, not just sentiment. Financial services are heavily regulated, incumbents hold the licenses and the trust, and enterprise sales cycles routinely take more than a year before a contract closes, a combination that demands more capital and patience than a three-month batch rewards. The same logic applies to drug discovery and other deep-tech categories: five-to-ten-year paths to revenue don't fit a demo-day model, regardless of how good the underlying science is. These categories didn't stop being valuable; they stopped being the kind of bet an accelerator is built to make. It's also why fintech is worth revisiting rather than writing off: the regulatory friction that emptied it out of YC is exactly what agentic AI is now positioned to chip away at.
Neither collapse means the underlying technology failed; plenty of durable companies came out of both waves. What the curves show is how quickly accelerator attention reallocates once the marginal idea in a category stops looking venture-scale. It took roughly three years for fintech to go from peak to half-peak. Anyone extrapolating today's AI share in a straight line should keep that number in mind: not as a prediction, but as a base rate.
The one to watch: hard tech is quietly tripling
One more trend deserves mention, because it is easy to miss next to the AI headline: industrials. It's also the hardest to square with everything above: hard tech carries fintech's same capital intensity and long cycle lengths, and its share is growing anyway. For most of YC's history, industrial companies made up a stable ~5% of each batch. In the 2026 batches they are at 12–14%, and robotics, hard tech, and hardware tags have grown alongside. Winter 2026 alone includes more robotics-tagged companies than some entire years of earlier batches.
This is a meaningful departure for an accelerator whose model (small checks, three-month cycles, demo day) was built around software economics. Whether it reflects genuinely improved economics for hardware startups (cheaper components, AI-enabled automation, reshoring tailwinds) or simply the search for the next non-crowded frontier, YC putting real batch share into atoms rather than bits is a signal worth tracking over the next few cycles.
Methodology and honest caveats
The dataset comes from Y Combinator's public company directory, retrieved via yc-oss/api, an open-source project that mirrors YC's search index daily. It covers publicly launched companies only, stealth companies appear in the data only once YC publishes them, which is why the newest batches are still growing and were handled carefully in the charts.
Three caveats matter for interpretation. First, tag coverage is incomplete for the most recent batches: at retrieval time, only about a fifth of Winter and Spring 2026 companies had been tagged, so tag-based charts end at Fall 2025; industry classifications, by contrast, are complete for all 50 batches and support the full timeline. Second, companies carry multiple industry labels, so shares across industries can sum to more than 100%, each line should be read independently, not as slices of a pie. Third, this data measures what YC funds and how YC labels it, which is a proxy for early-stage attention, not a measurement of market size, revenue, or eventual outcomes.
All data, collection scripts, and the R code behind every chart are in the repository. If you spot an error or want to extend the analysis, issues and pull requests are welcome.
Further Reading
- YC_Analysis repository. The full dataset (6,020 companies, 50 batches), collection scripts, and R analysis code behind every chart in this article.
- yc-oss/api. The open-source daily mirror of Y Combinator's public company directory used as the data source.
- YC Startup Directory. Y Combinator's own browsable directory of every funded company.
- On the freakishly strong YC26 batch. Jared Heyman analysis on 2026 batch.